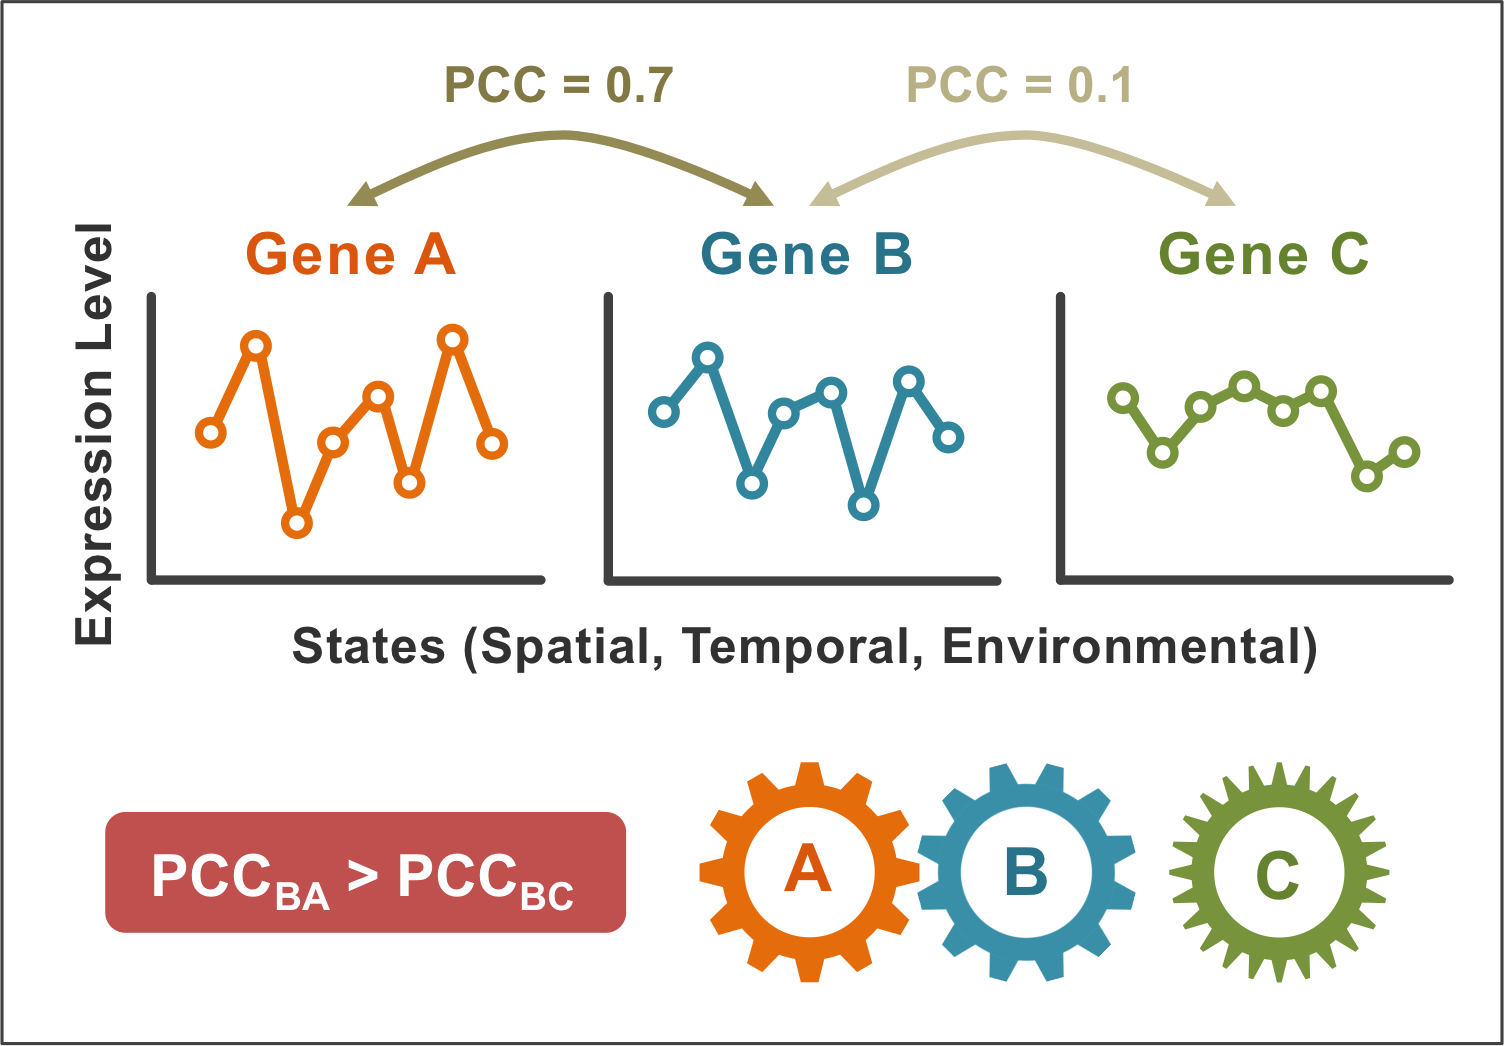
Gene coexpression is a similarity of expression profiles between a pair of genes.
Functionally related genes are generally expressed together on spatial-temporal states or environmental conditions,
and thus, gene coexpression provides us powerful information to estimate the functions of uncharacterized genes.
For example, in the right case,
Gene B is more coordinately expressed with
Gene A than Gene C.
Usually, Pearson's Correlation Coefficient (PCC) is used as a measure of gene coexpression.
"PCC = 1" indicates strong relationship in an aspect of gene expression regulation, "PCC = 0" indicates no relationship.
In this case, the PCC between Gene B and Gene A (PCCBA)
is larger than that between Gene B and Gene C (PCCBC).
This suggests that Gene B is more likely to cooperate with
Gene A than Gene C,
e.g., function in a same biosynthetic pathway or interact each other to construct a large protein complex.
This Guilt-By-Association-based gene function prediction has been succeeded in clarifying the various complex biological phenomena.
Databases for Gene Coexpression
Currently, there are several gene coexpression databases developed by other researchers, which targeting a variety of organisms.
Animals
COXPRESSdb
[ Homo sapiens, Mus musculus, Drosophila melanogaster, etc. (11 organisms) ]
WebSitePubMed
GeneFriends
[ Homo sapiens, Mus musculus (2 organisms) ]
WebSitePubMed
Human Gene Coexpression
[ Homo sapiens (1 organism) ]
WebSitePubMed
Microalgae have been attracting a lot of attention as a promising source
for biofuel feedstock or animal feed, and also as model organisms to investigate the plant cell evolution.
To date, only a small fraction of microalgal genes can be said to be functionally characterized,
and thus, bioinformatical support is required to clarify the remaining genes.
As listed above, however, there is a limited number of gene coexpression databases for algal species.
Hence, in order to facilitate the microalgal research,
we newly developed an Algae Gene Coexpression Database (ALCOdb),
which provides gene coexpression data for a wide range of microalgae.
On the release data (2014.9.17), ALCOdb supports two unicellular microalgae:
a green alga Chlamydomonas reinhardtii and a red alga Cyanidioschyzon merolae.
We will expand supporting organisms by regular updates and
make ALCOdb more comprehensive coexpression database for microalgal species.
Tutorials
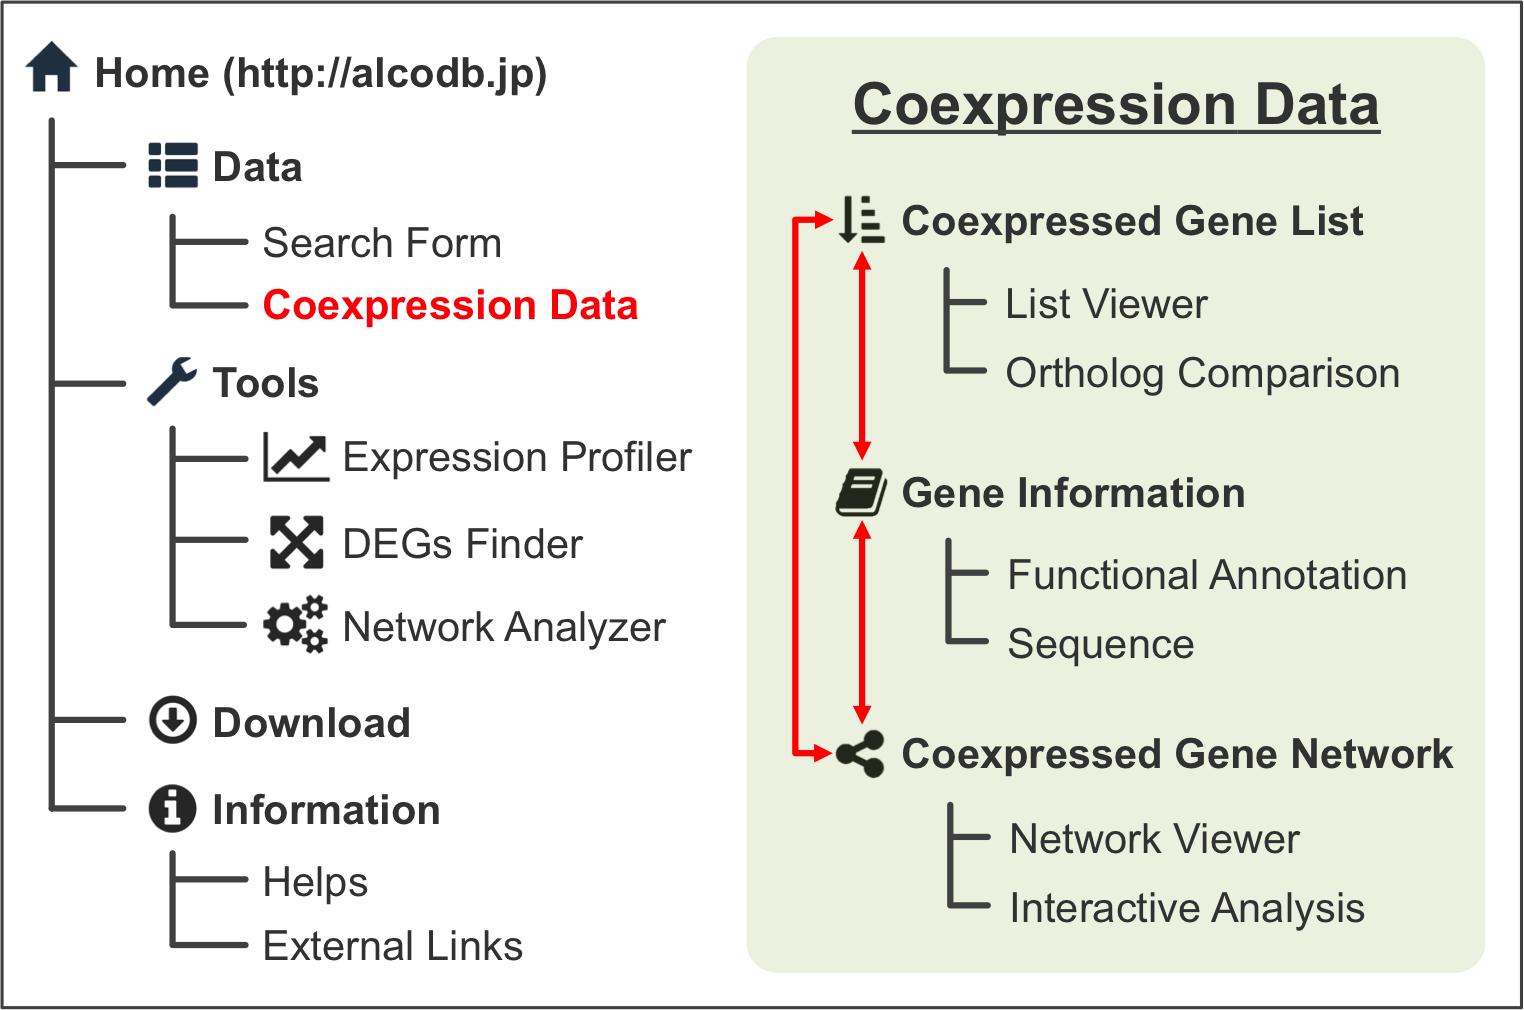
Page Structure
The site diagram of ALCOdb is shown right.
Briefly, users can access main contents of ALCOdb (i.e. Coexpression Data)
from the Data menu
(located on the top menu bar) through a search form.
Users can search the genes of interest or select them from the available gene list.
ALCOdb provides three information pages for each gene:
(ⅰ) Coexpressed Gene List,
(ⅱ) Coexpressed Gene Netwok and
(ⅲ) Gene Information.
Users can go back and forth among these pages smoothly
get an insight into the biological role of their interesting genes.
For more information, please read the Site Details section shown below.
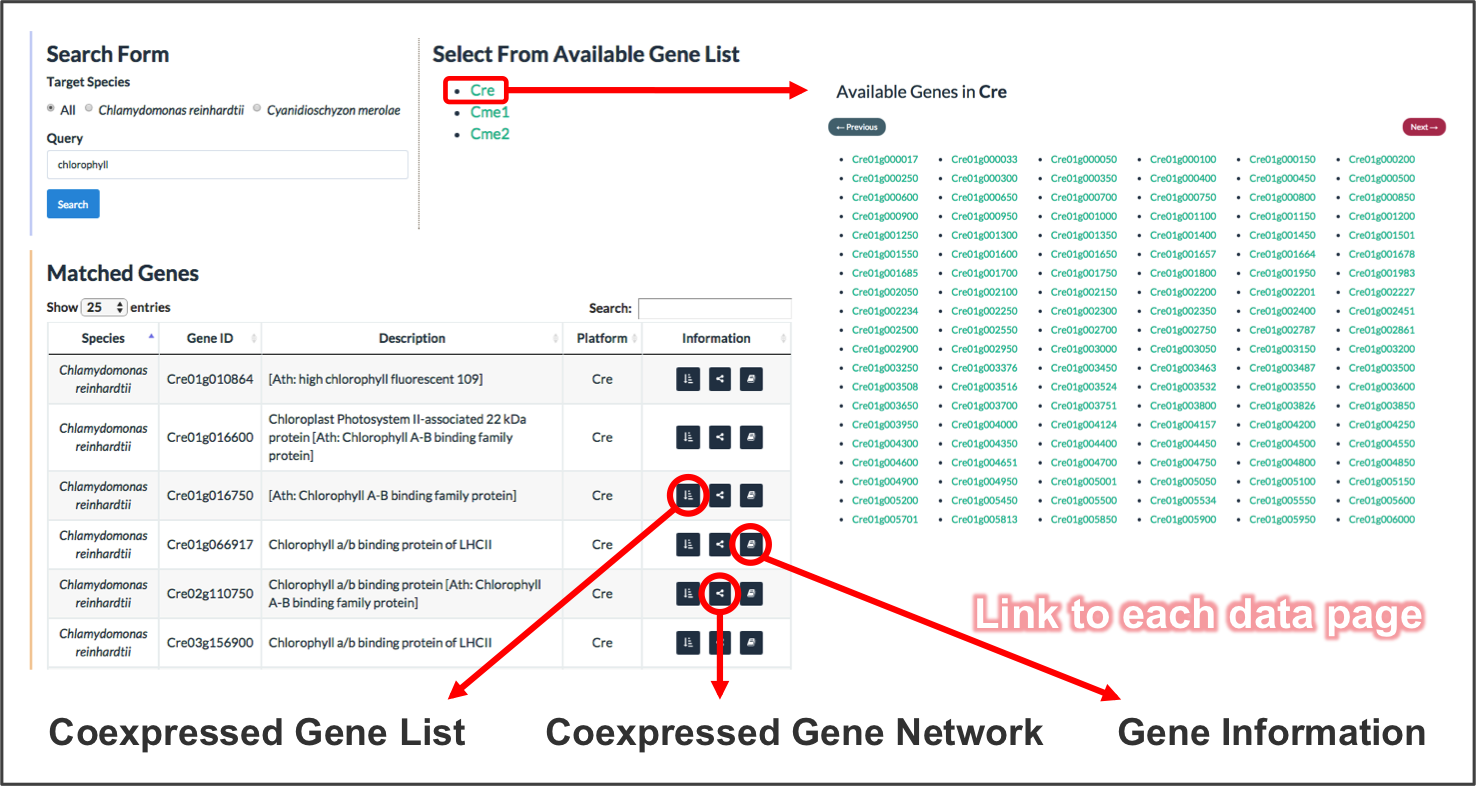
Data menu is
the entry point into the main contents (i.e. Coexpression Data) of ALCOdb.
From the search form, users can search the genes of interest by IDs, symbols or any keywords.
If there are any hits, links to Coexpression Data (
Coexpressed Gene List,
Coexpressed Gene Netwok and
Gene Information
) will be provided.
Alternatively, users can select a target from the available gene list.
By clicking the ID of interest, users can move to
its Coexpressed Gene List page.
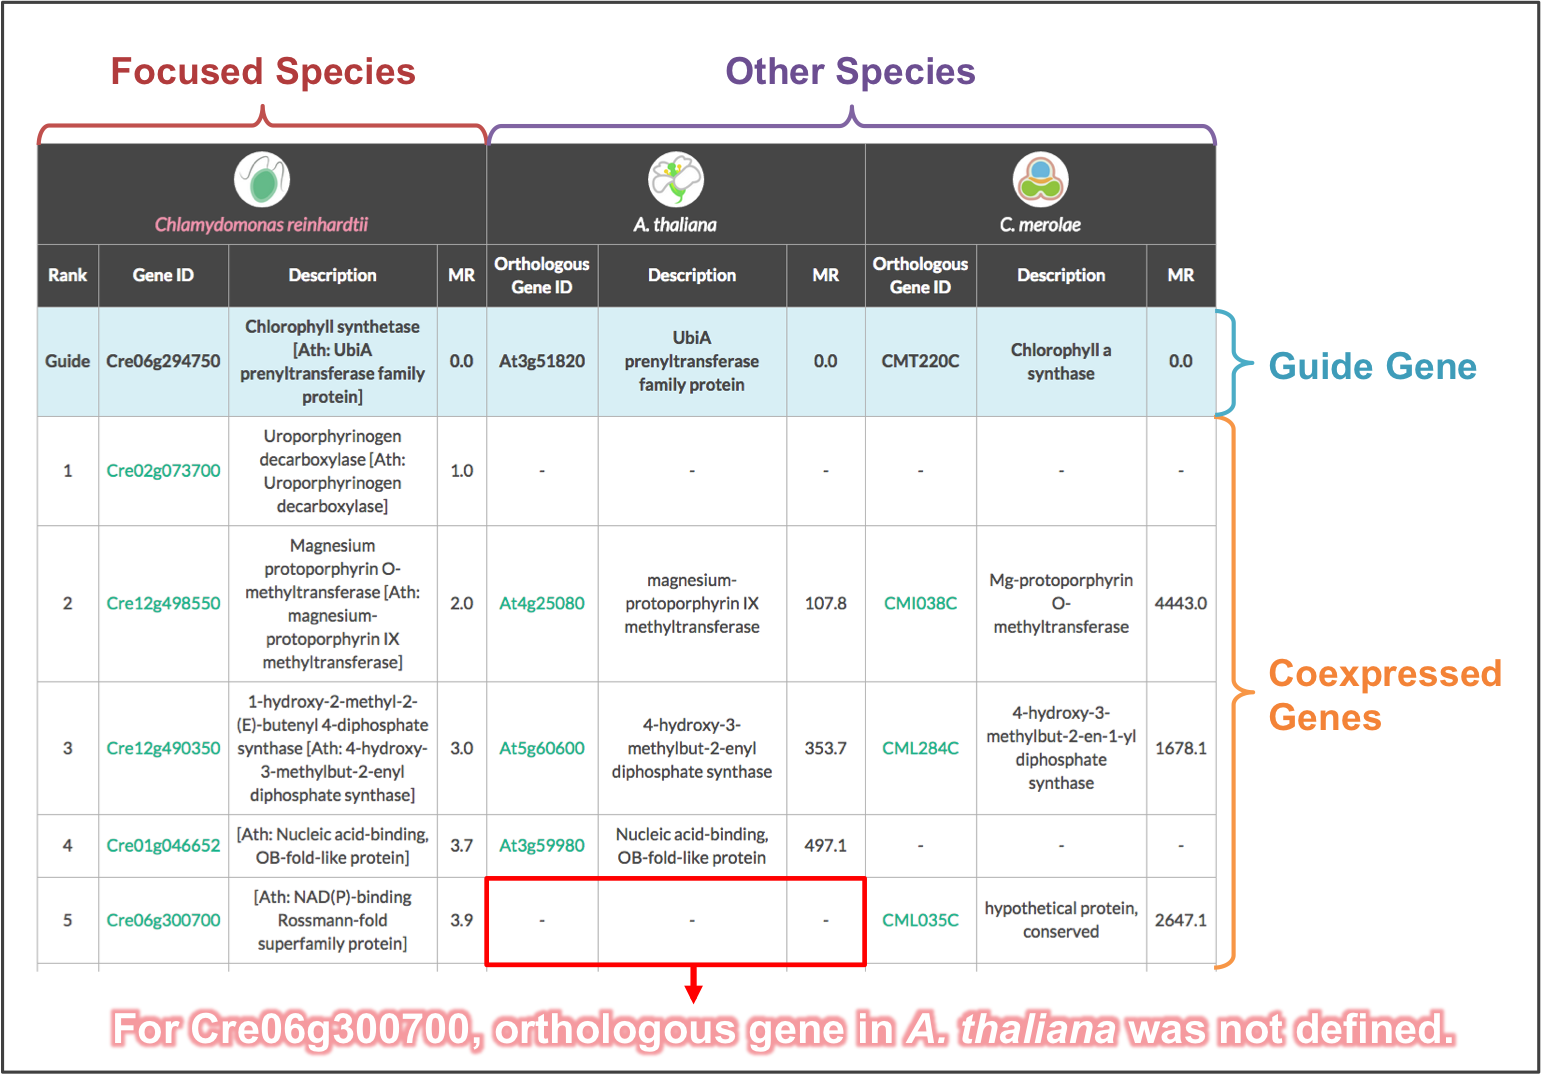
Coexpressed Gene List page
provides coexpressed genes in a list style along with their orthologous relationships.
An example of a coexpressed gene list, the C. reinhardtiiCHLG gene is used as the guide gene, is shown below.
The four columns on the left show the coexpressed genes,
which is sorted in ascending order of their Mutual Rank (MR) values, in focused species (C. reinhardtii).
A smaller MR value indicates a stronger gene coexpression.
The six columns on the right indicate the degree of coexpression for ortholog pairs in other species
(A. thaliana and C. merolae).
Orthologous genes were defined by reciprocal best BLASTP hits.
The gene coexpression data for A. thaliana were retrieved from ATTED-II.
Cells with "−" mean that gene coexpression data were not available due to no orthologous gene.
This example is available from here.
Coexpressed Gene Network page
provides coexpressed genes in a network style with the interactive analysis tool
(implemented by using Cytoscape.js).
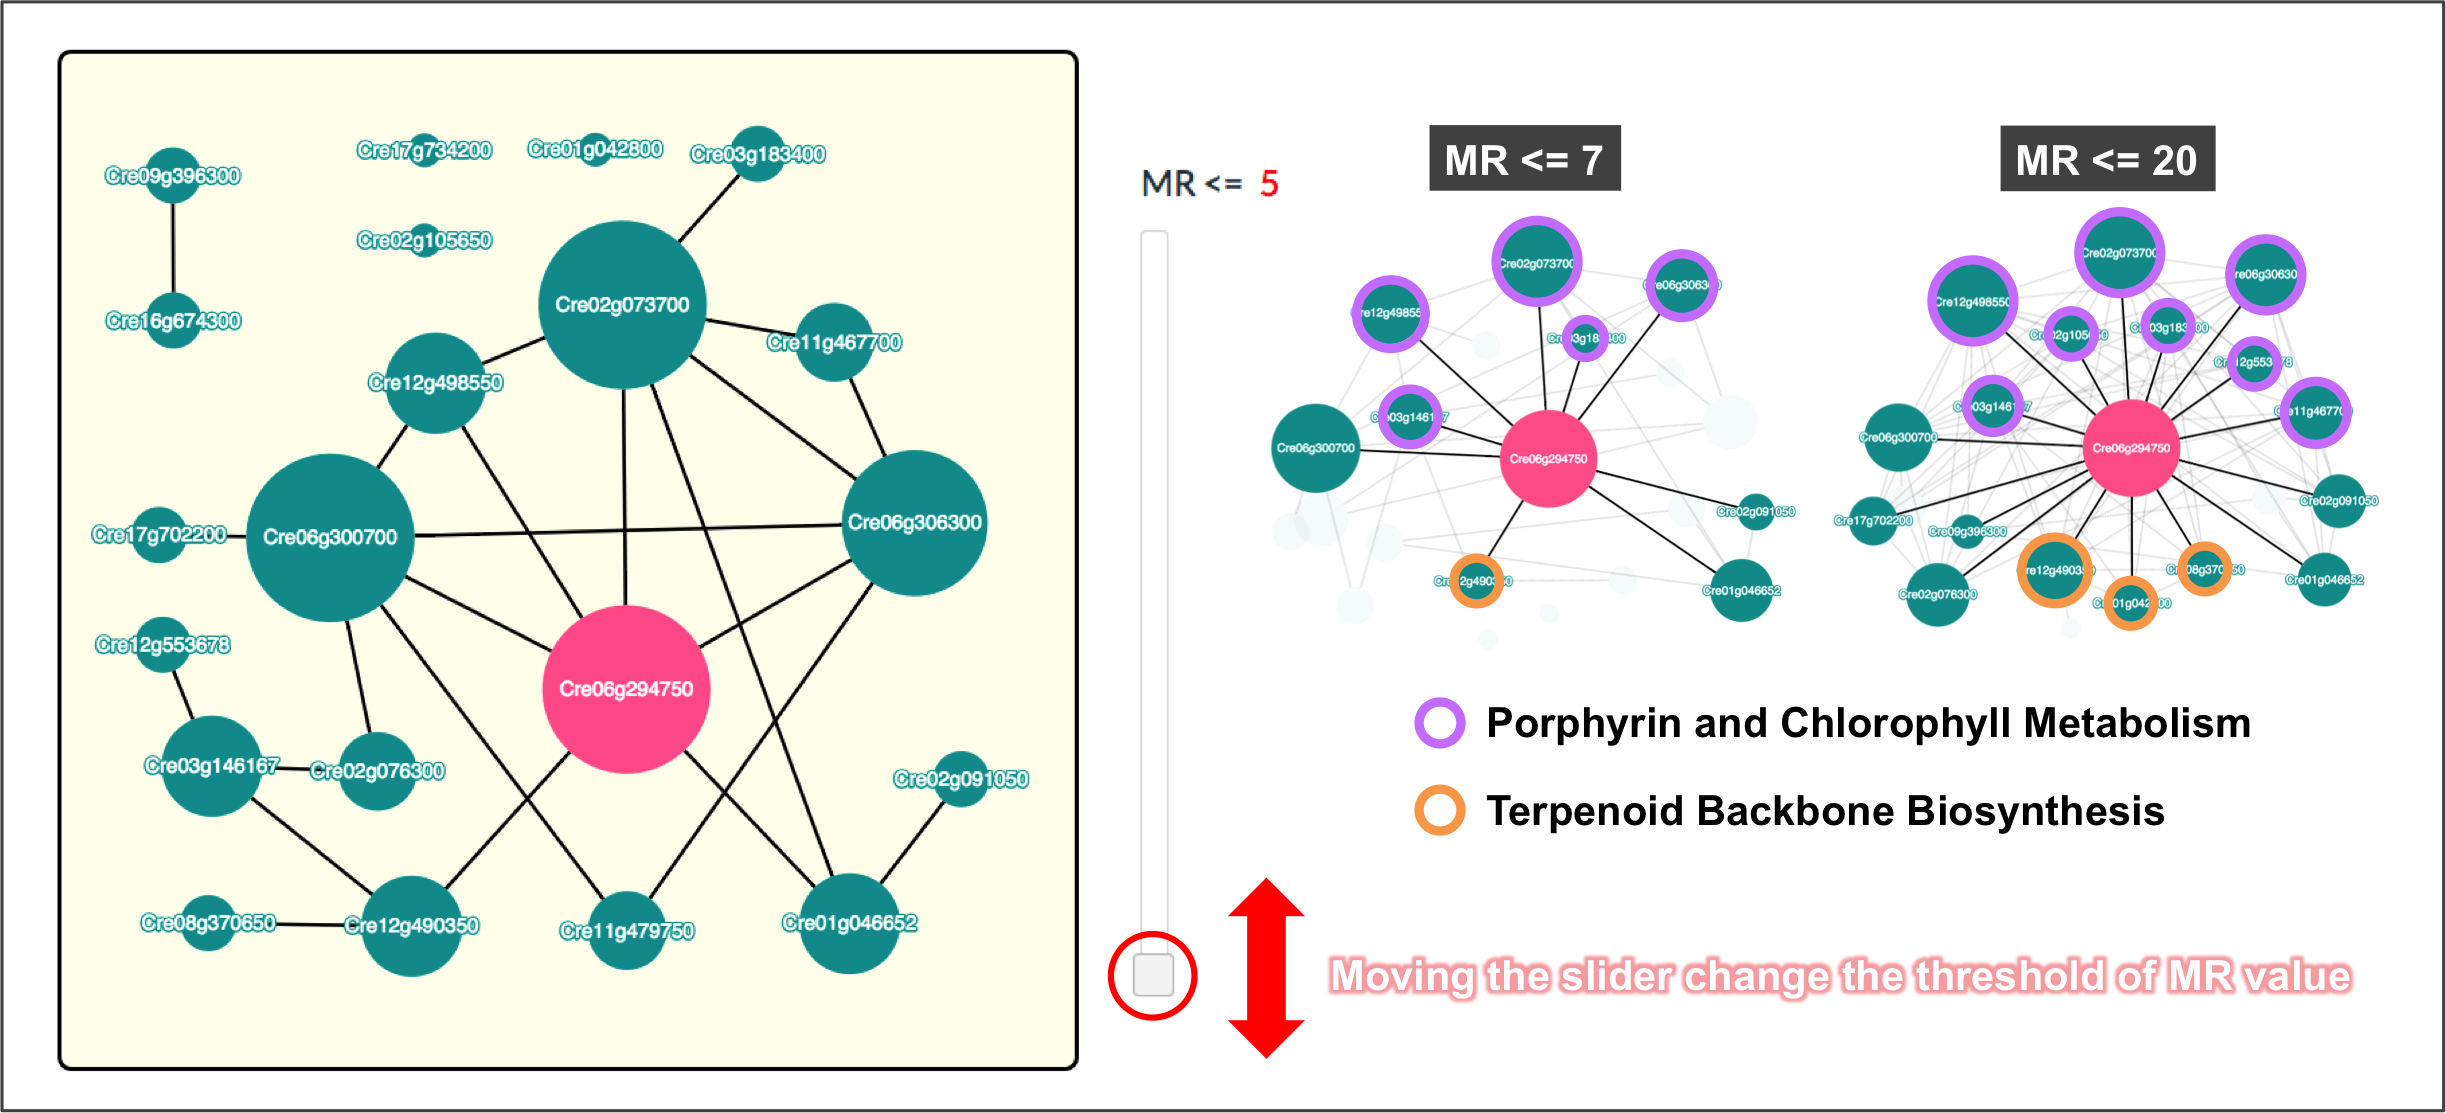
An example of a coexpressed gene network, the C. reinhardtiiCHLG gene is used as the guide gene, is shown below.
Red node indicates a guide gene and green nodes indicate its coexpressed genes.
To generate a network, the 5 most strongly coexpressed genes for a guide gene and
the 3 most strongly coexpressed genes for each of them (total 20 genes surrounding a guide gene) were selected.
Then, any gene pairs whose MR value is not greater than a threshold are connected.
Users can change the threshold interactively on the browser side and obtain a network with an arbitrary threshold.
This strategy enables users to find functional modules
(set of coexpressed genes sharing a common KEGG Pathway)
and to estimate the function of a guide gene quantitatively.
In this case, the coexpression network contains two functional modules:
(A) Porphyrin and Chlorophyll Metabolism and
(B) Terpenoid Backbone Biosynthesis.
By changing the threshold of MR value,
it is revealed that the CHLG gene is more functionally associated with
module A than module B.
This might reflect the fact that
CHLG protein is directory involved in the chlorophyll biosynthesis, and
a phytyl diphosphate (one of the terpenoid) is required in the reaction.
The resultant graphs can be saved as PNG files.
This example is available from here.
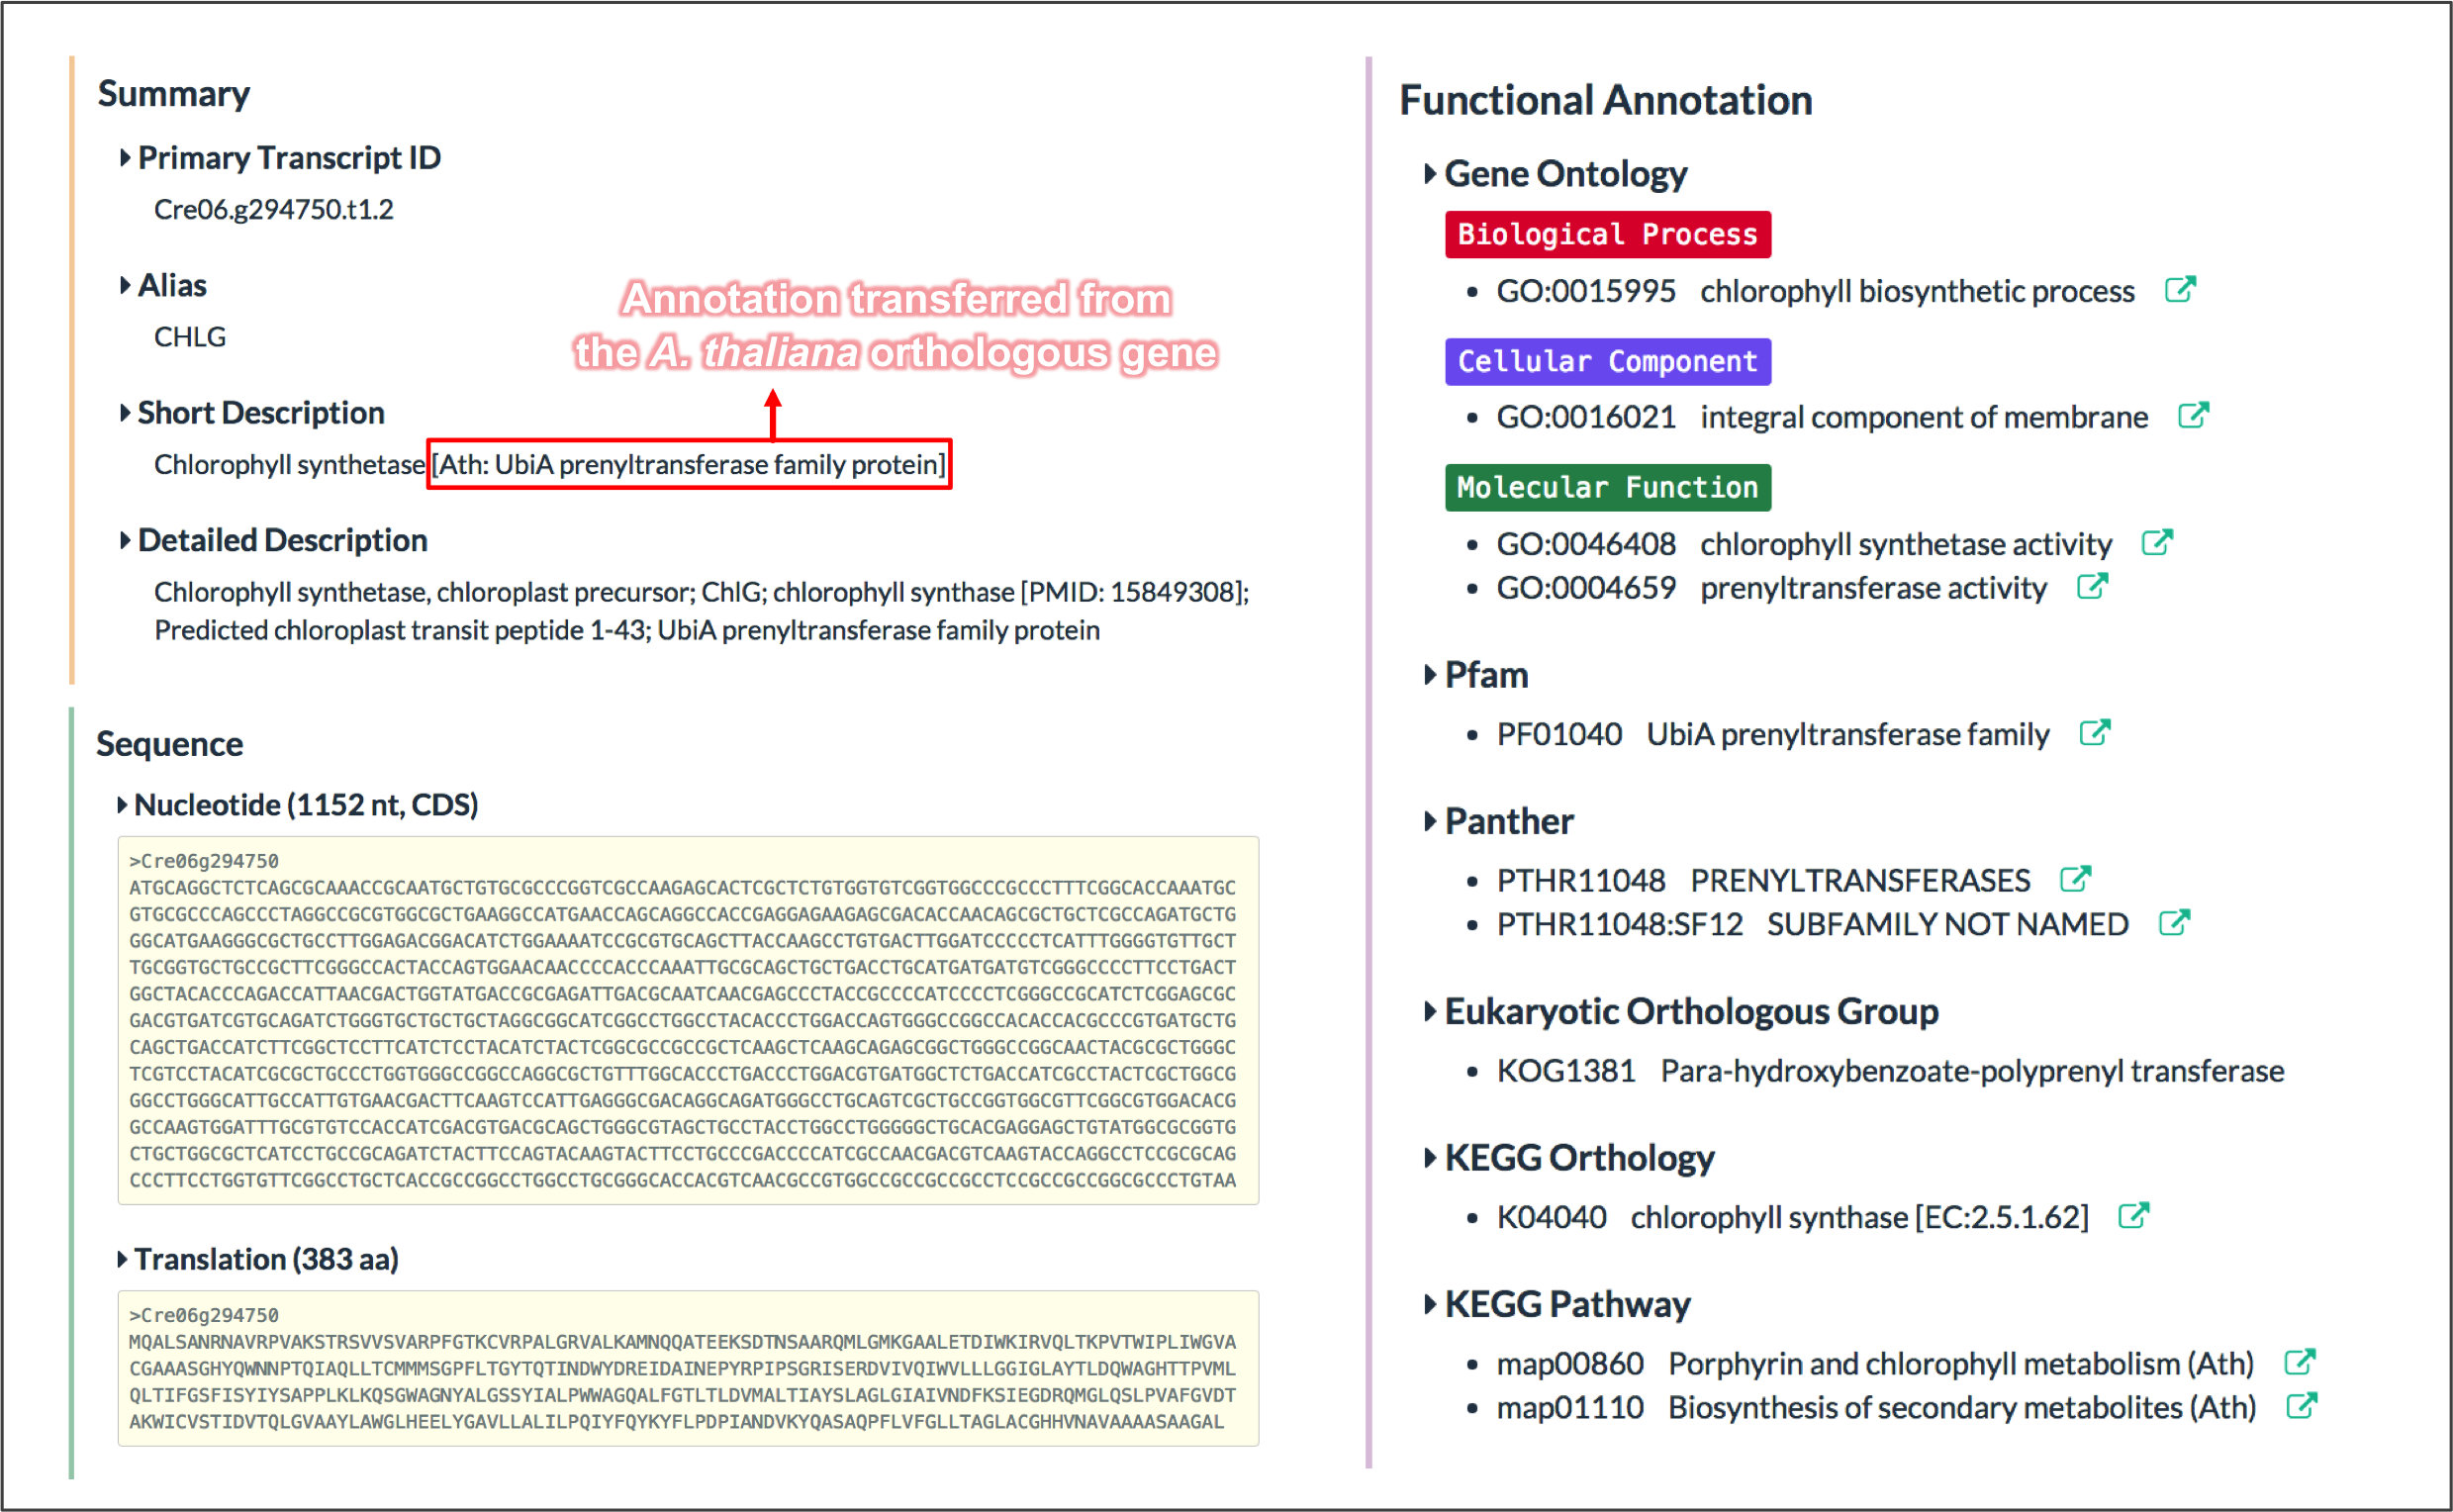
Gene Information page
provides Functional Annotation and Sequence for each guide gene.
An example of this page, the C. reinhardtiiCHLG gene is used as the guide gene, is shown below.
Functional Annotation section consists of following items:
(ⅰ) Gene Ontology,
(ⅱ) Pfam,
(ⅲ) PANTHER,
(ⅳ) Eukaryotic Orthologous Group,
(ⅴ) KEGG Orthology, and
(ⅵ) KEGG Pathway.
Sequence section includes the coding DNA sequence (CDS) and its deduced protein sequence.
The annotation and sequence data for C. reinhardtii, C. merolae, and A. thaliana were retrieved from
the Phytozome v10 database (C. reinhardtii v5.5),
the C. merolae Genome Project, and
the TAIR database (TAIR10), respectively.
For C. reinhardtii genes, the knowledge of their orthologous genes in A. thaliana
were transferred to enhance the coverage of functional annotation.
Users can explore more detailed information for each items by using the external link .
This example is available from here.
From the Tools menu,
users can perform an advanced analysis with several helpful tools.
The details of each tool and an example of the usage scenario are shown below.
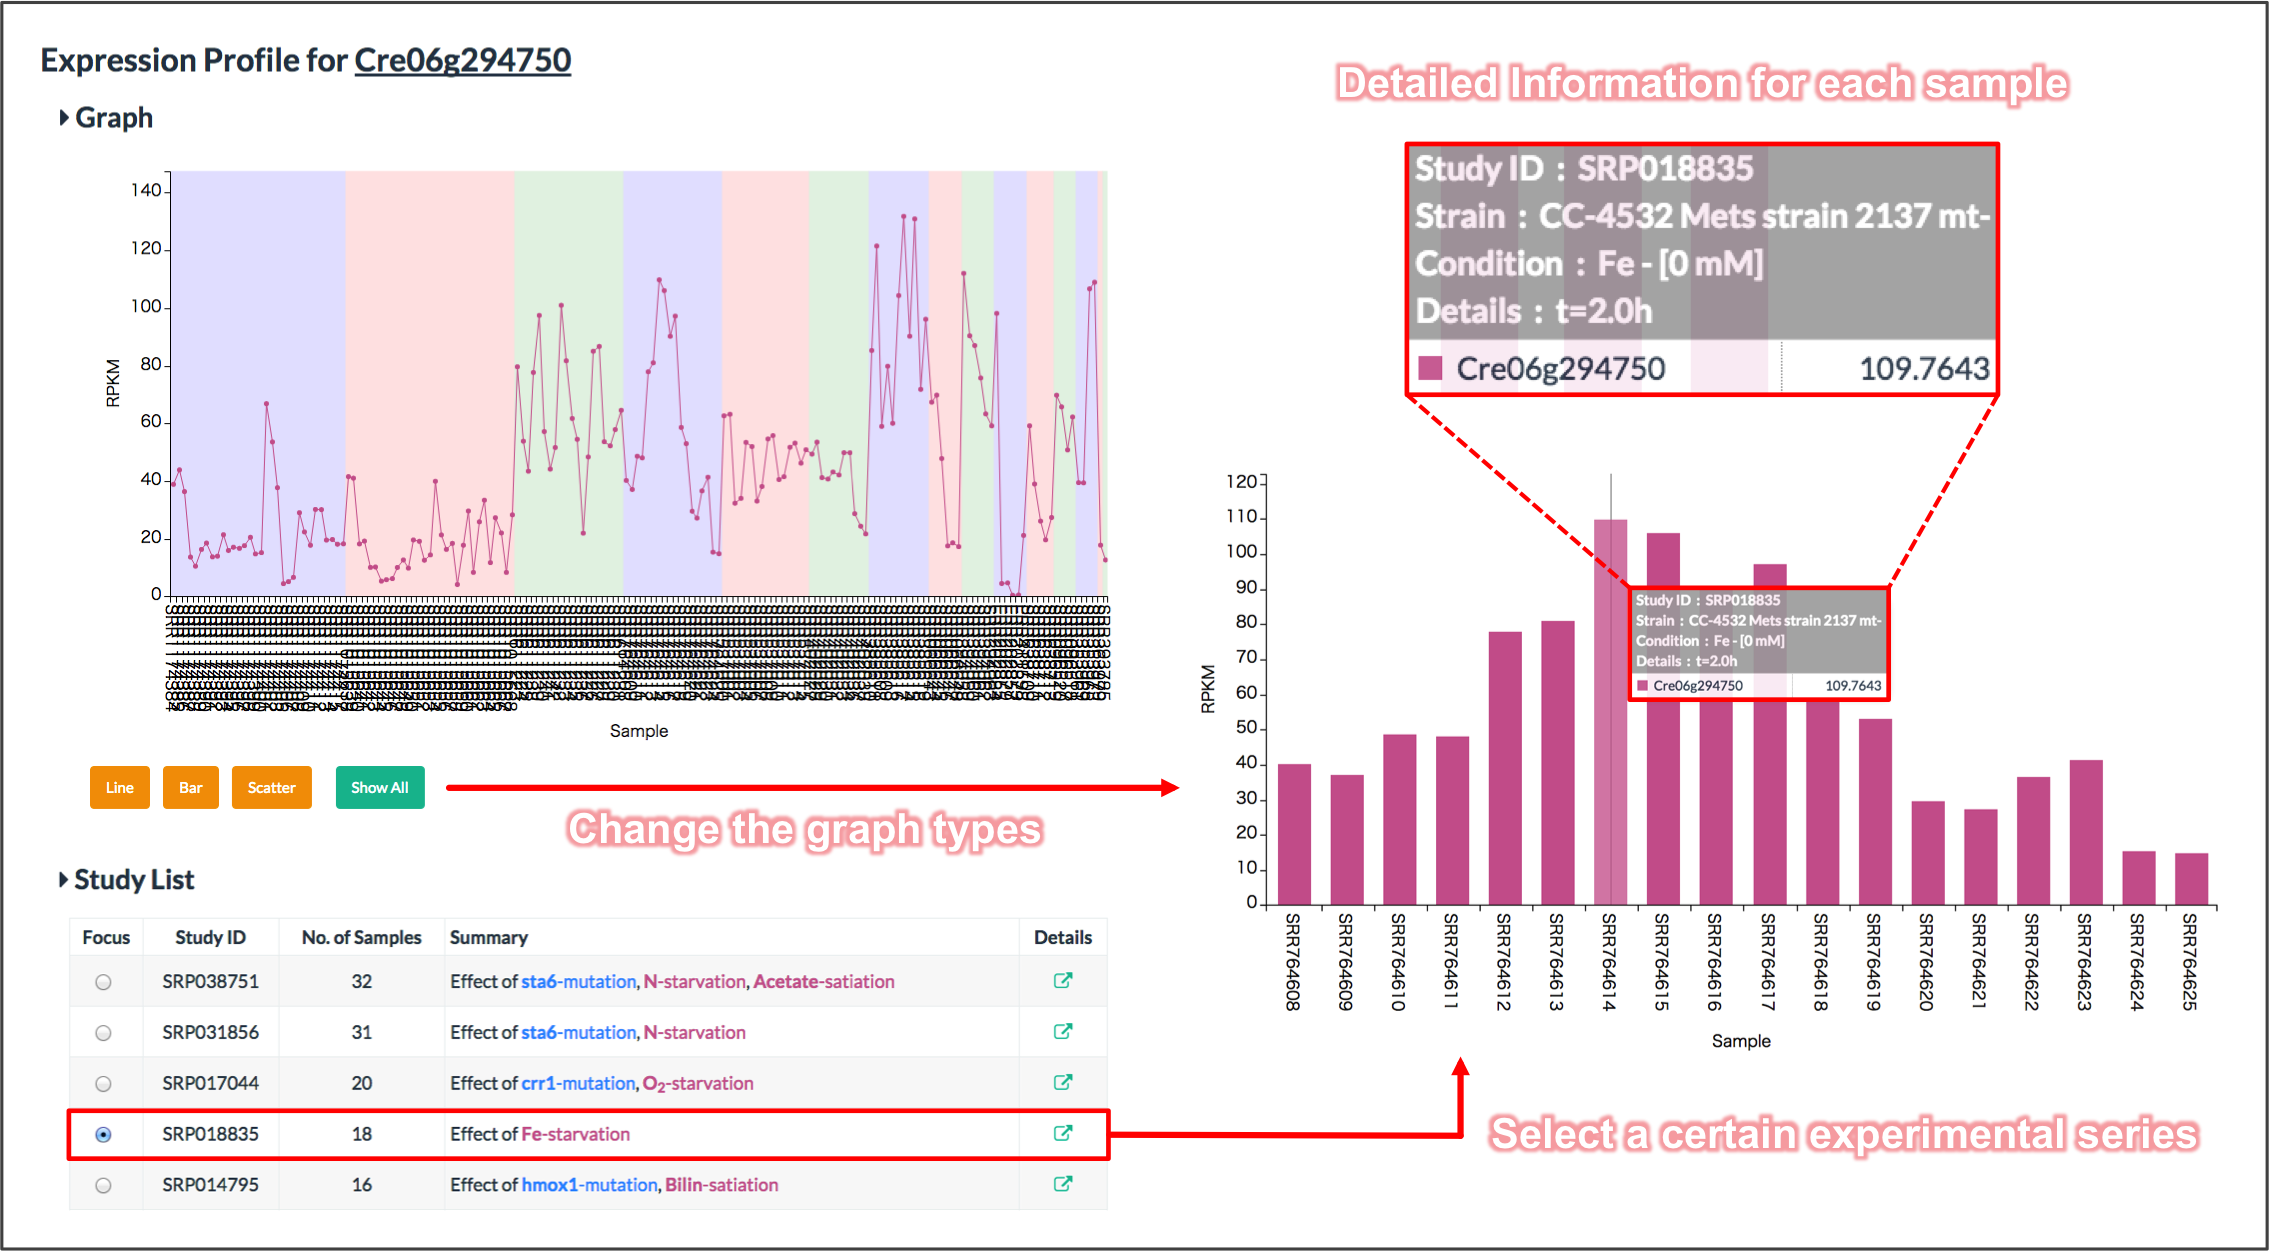
Expression Profiler is useful to explore the detailed expression profile of a certain gene.
Metadata of each RNA-seq data were manually curated and
summarized into an easy-to-understand style:
Strain (genotypes), Growth Conditions (environmental effects) and
Other Notices (time course, concentration of chemicals, and so on).
As shown in the below example, when user mouse hover on the graph,
the corresponding sample information were displayed (SRR764614, in this case).
The overall expression profile consists of several experimental series
(termed as Study in SRA/ERA/DRA), and
each Study can be focused by selecting its ID from the Study List.
With this tool, users can find the conditions where a gene of interest is highly (or lowly) expressed.
Currently, this tool only supports the genes in C. reinhardtii.
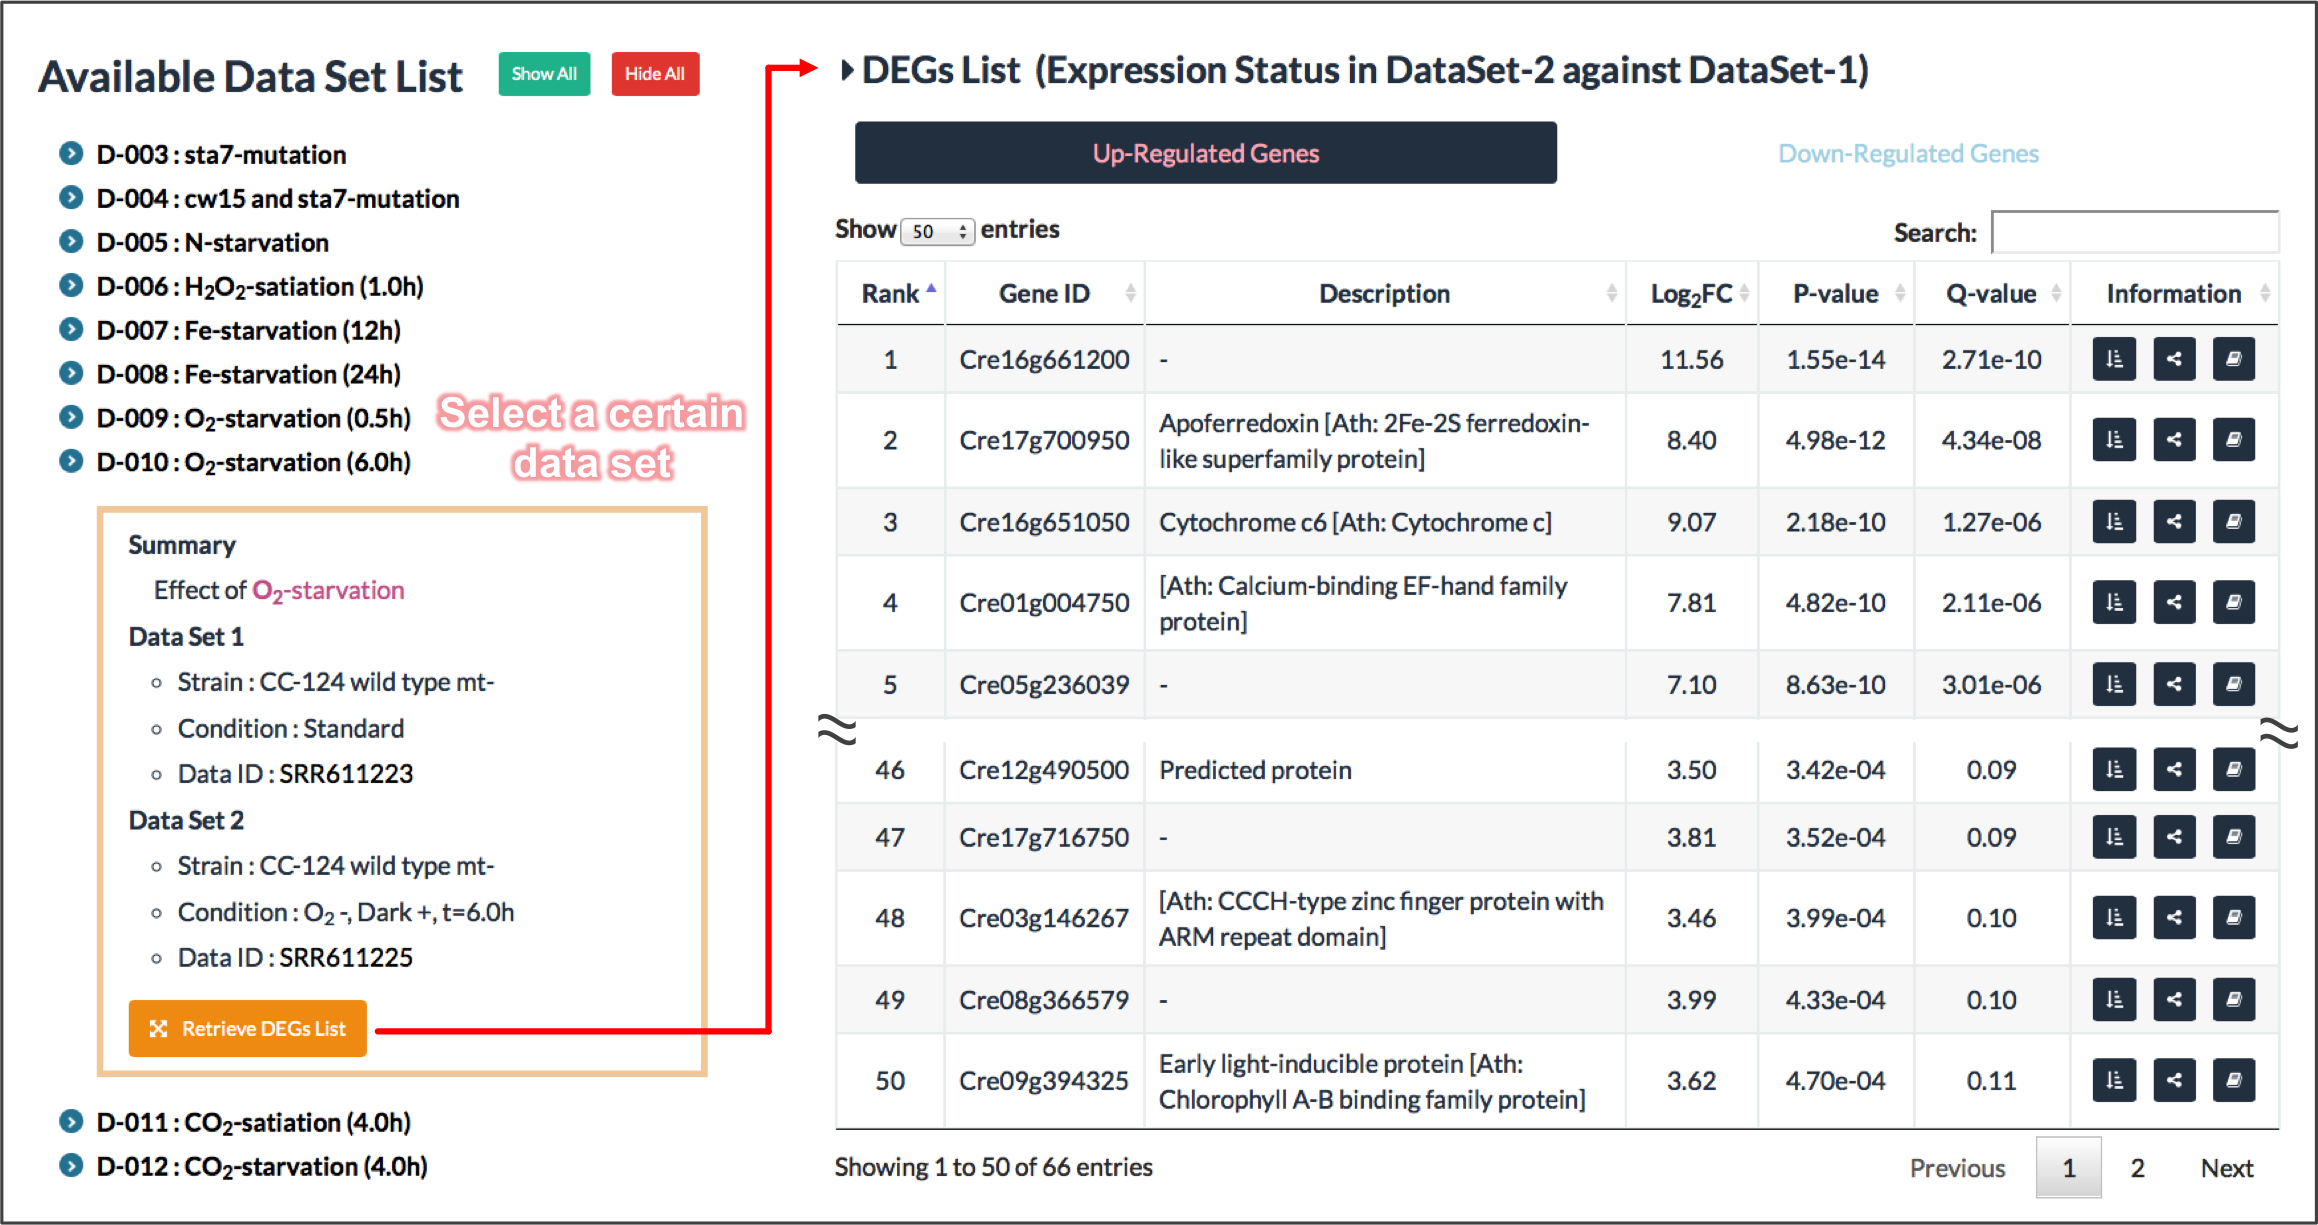
DEGs Finder provides
sets of differentially expressed genes (DEGs) for several conditions.
The identification of DEGs is a key step to understand the molecular mechanism underlying a specific biological process.
DEGs in a certain sample set were detected by using the TCC package and
the highly up/down regulated genes (the top 100 genes with statistical significance) were provided.
As shown in the below example, a DEGs list contains following items:
Rank, Gene ID, Gene Description, Fold Change (base-2 logarithm converted),
p-value, q-value and links to coexpression data.
The genes were sorted in ascending order of p-value; the lower the p-value, the more significant the difference.
The q-value corresponds to the minimum False Discovery Rate (FDR)
when a gene and the preceding genes were regarded as DEGs.
For the below example, if we regarded the top 50 genes in the list as DEGs (the q-value of 50th ranking gene is 0.11),
there were at least 5 false positives.
This tool allows users a flexible search of DEGs associated with various biological phenomena.
Currently, this tool only supports the genes in C. reinhardtii.
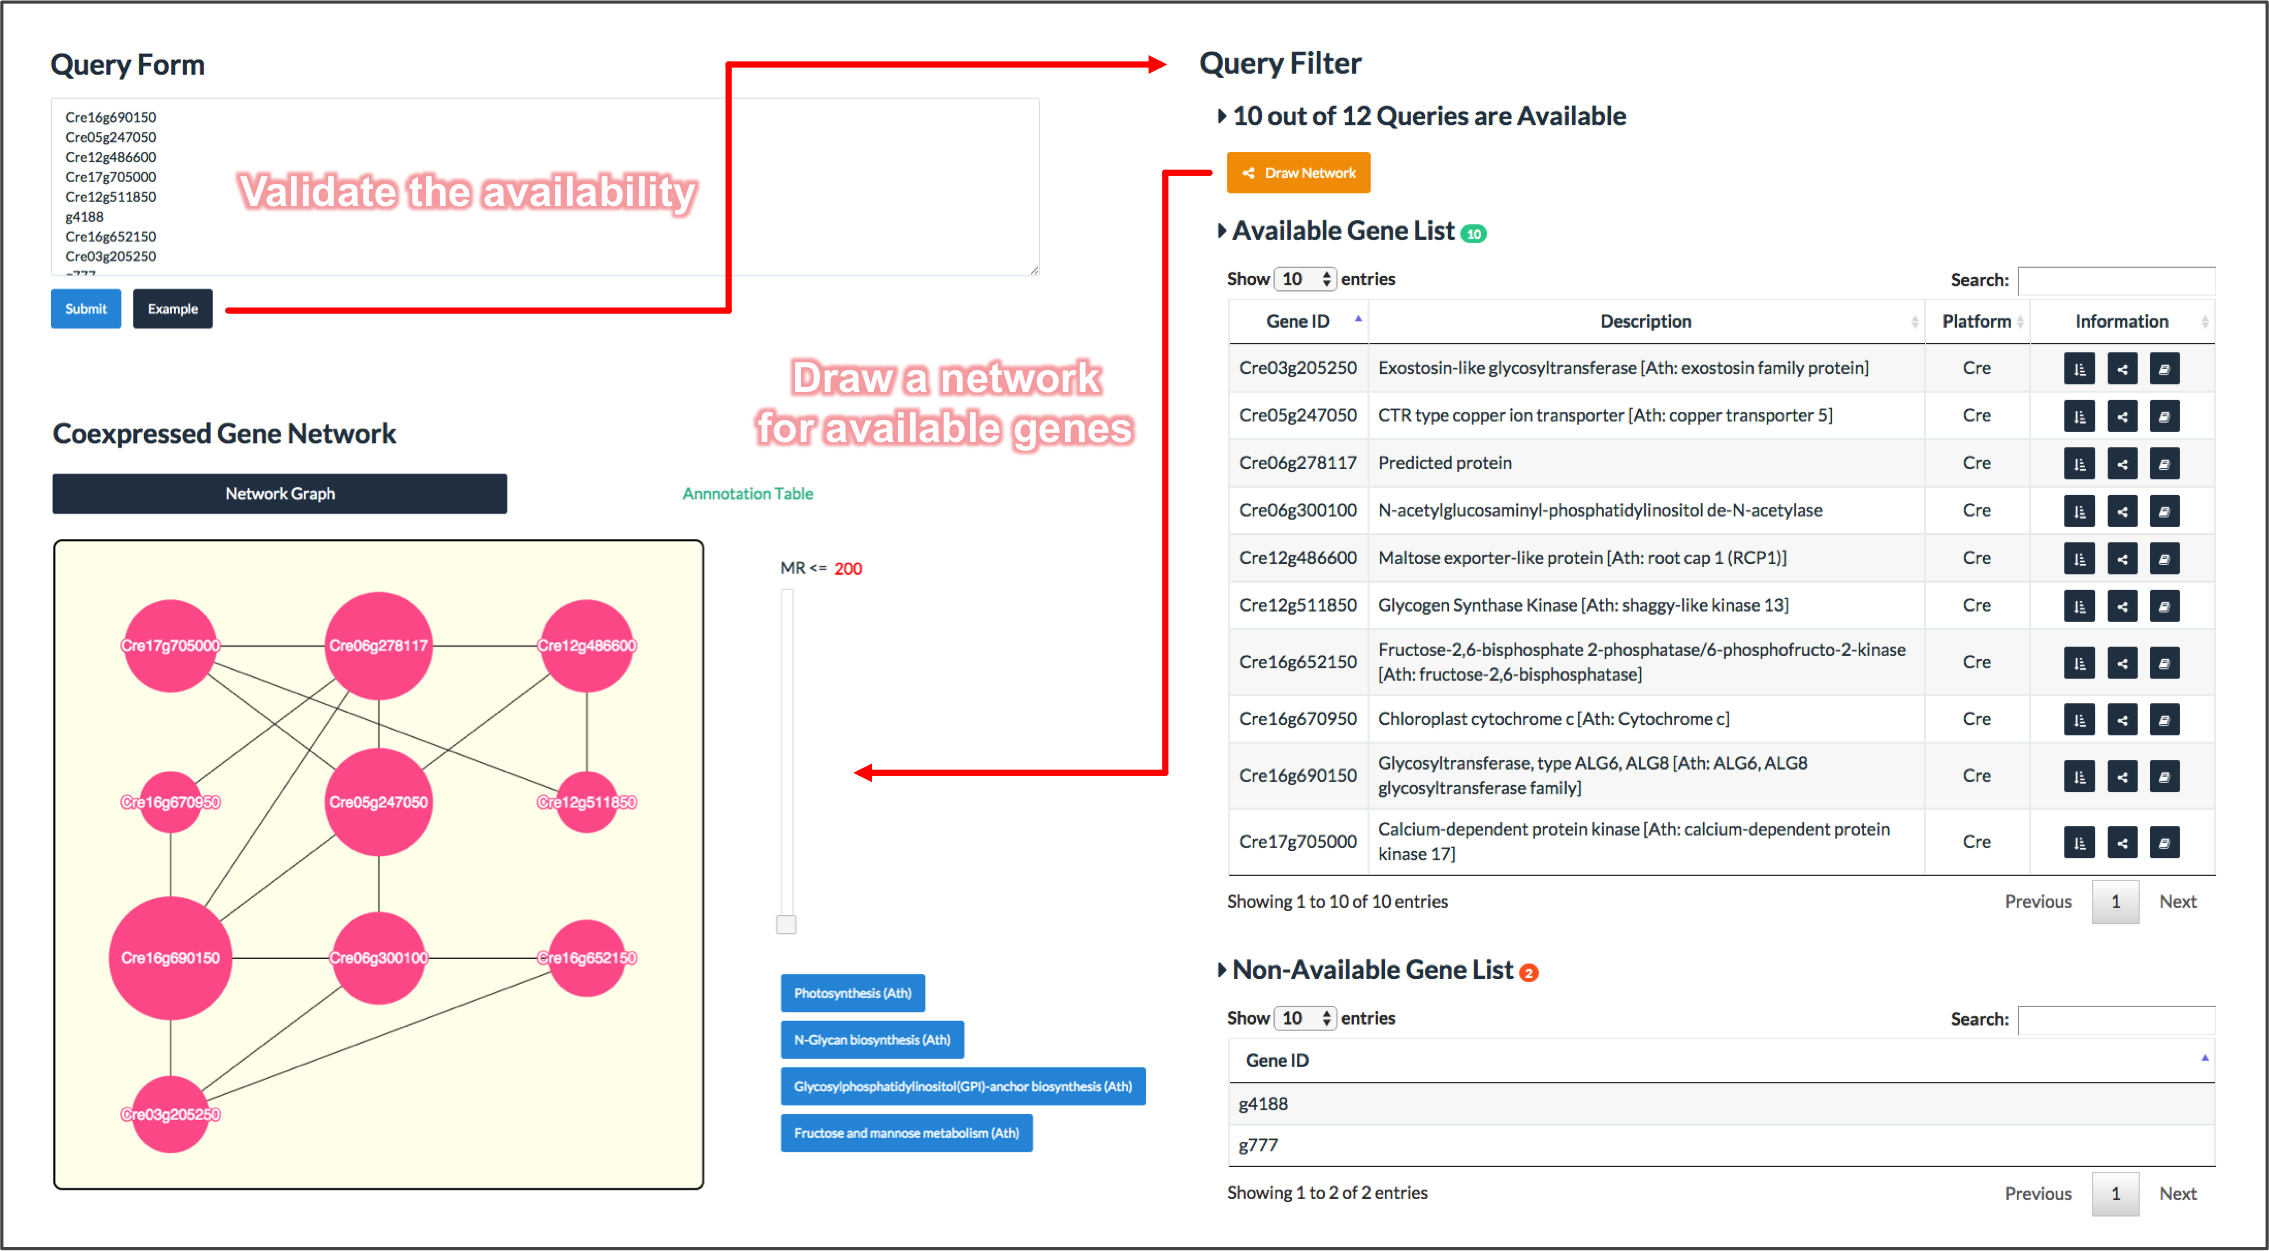
Network Analyzer enables users to draw a coexpression network of a user-defined set of genes.
This tool first validates the availability of coexpression data for each query,
and then provides a coexpression network for passed genes
(displayed in same style as the Coexpressed Gene Network).
An example is shown below.
Using this tool, users can explore the functional modules lurked in their focused gene set.
Currently, this tool only supports the genes in C. reinhardtii and A. thaliana.